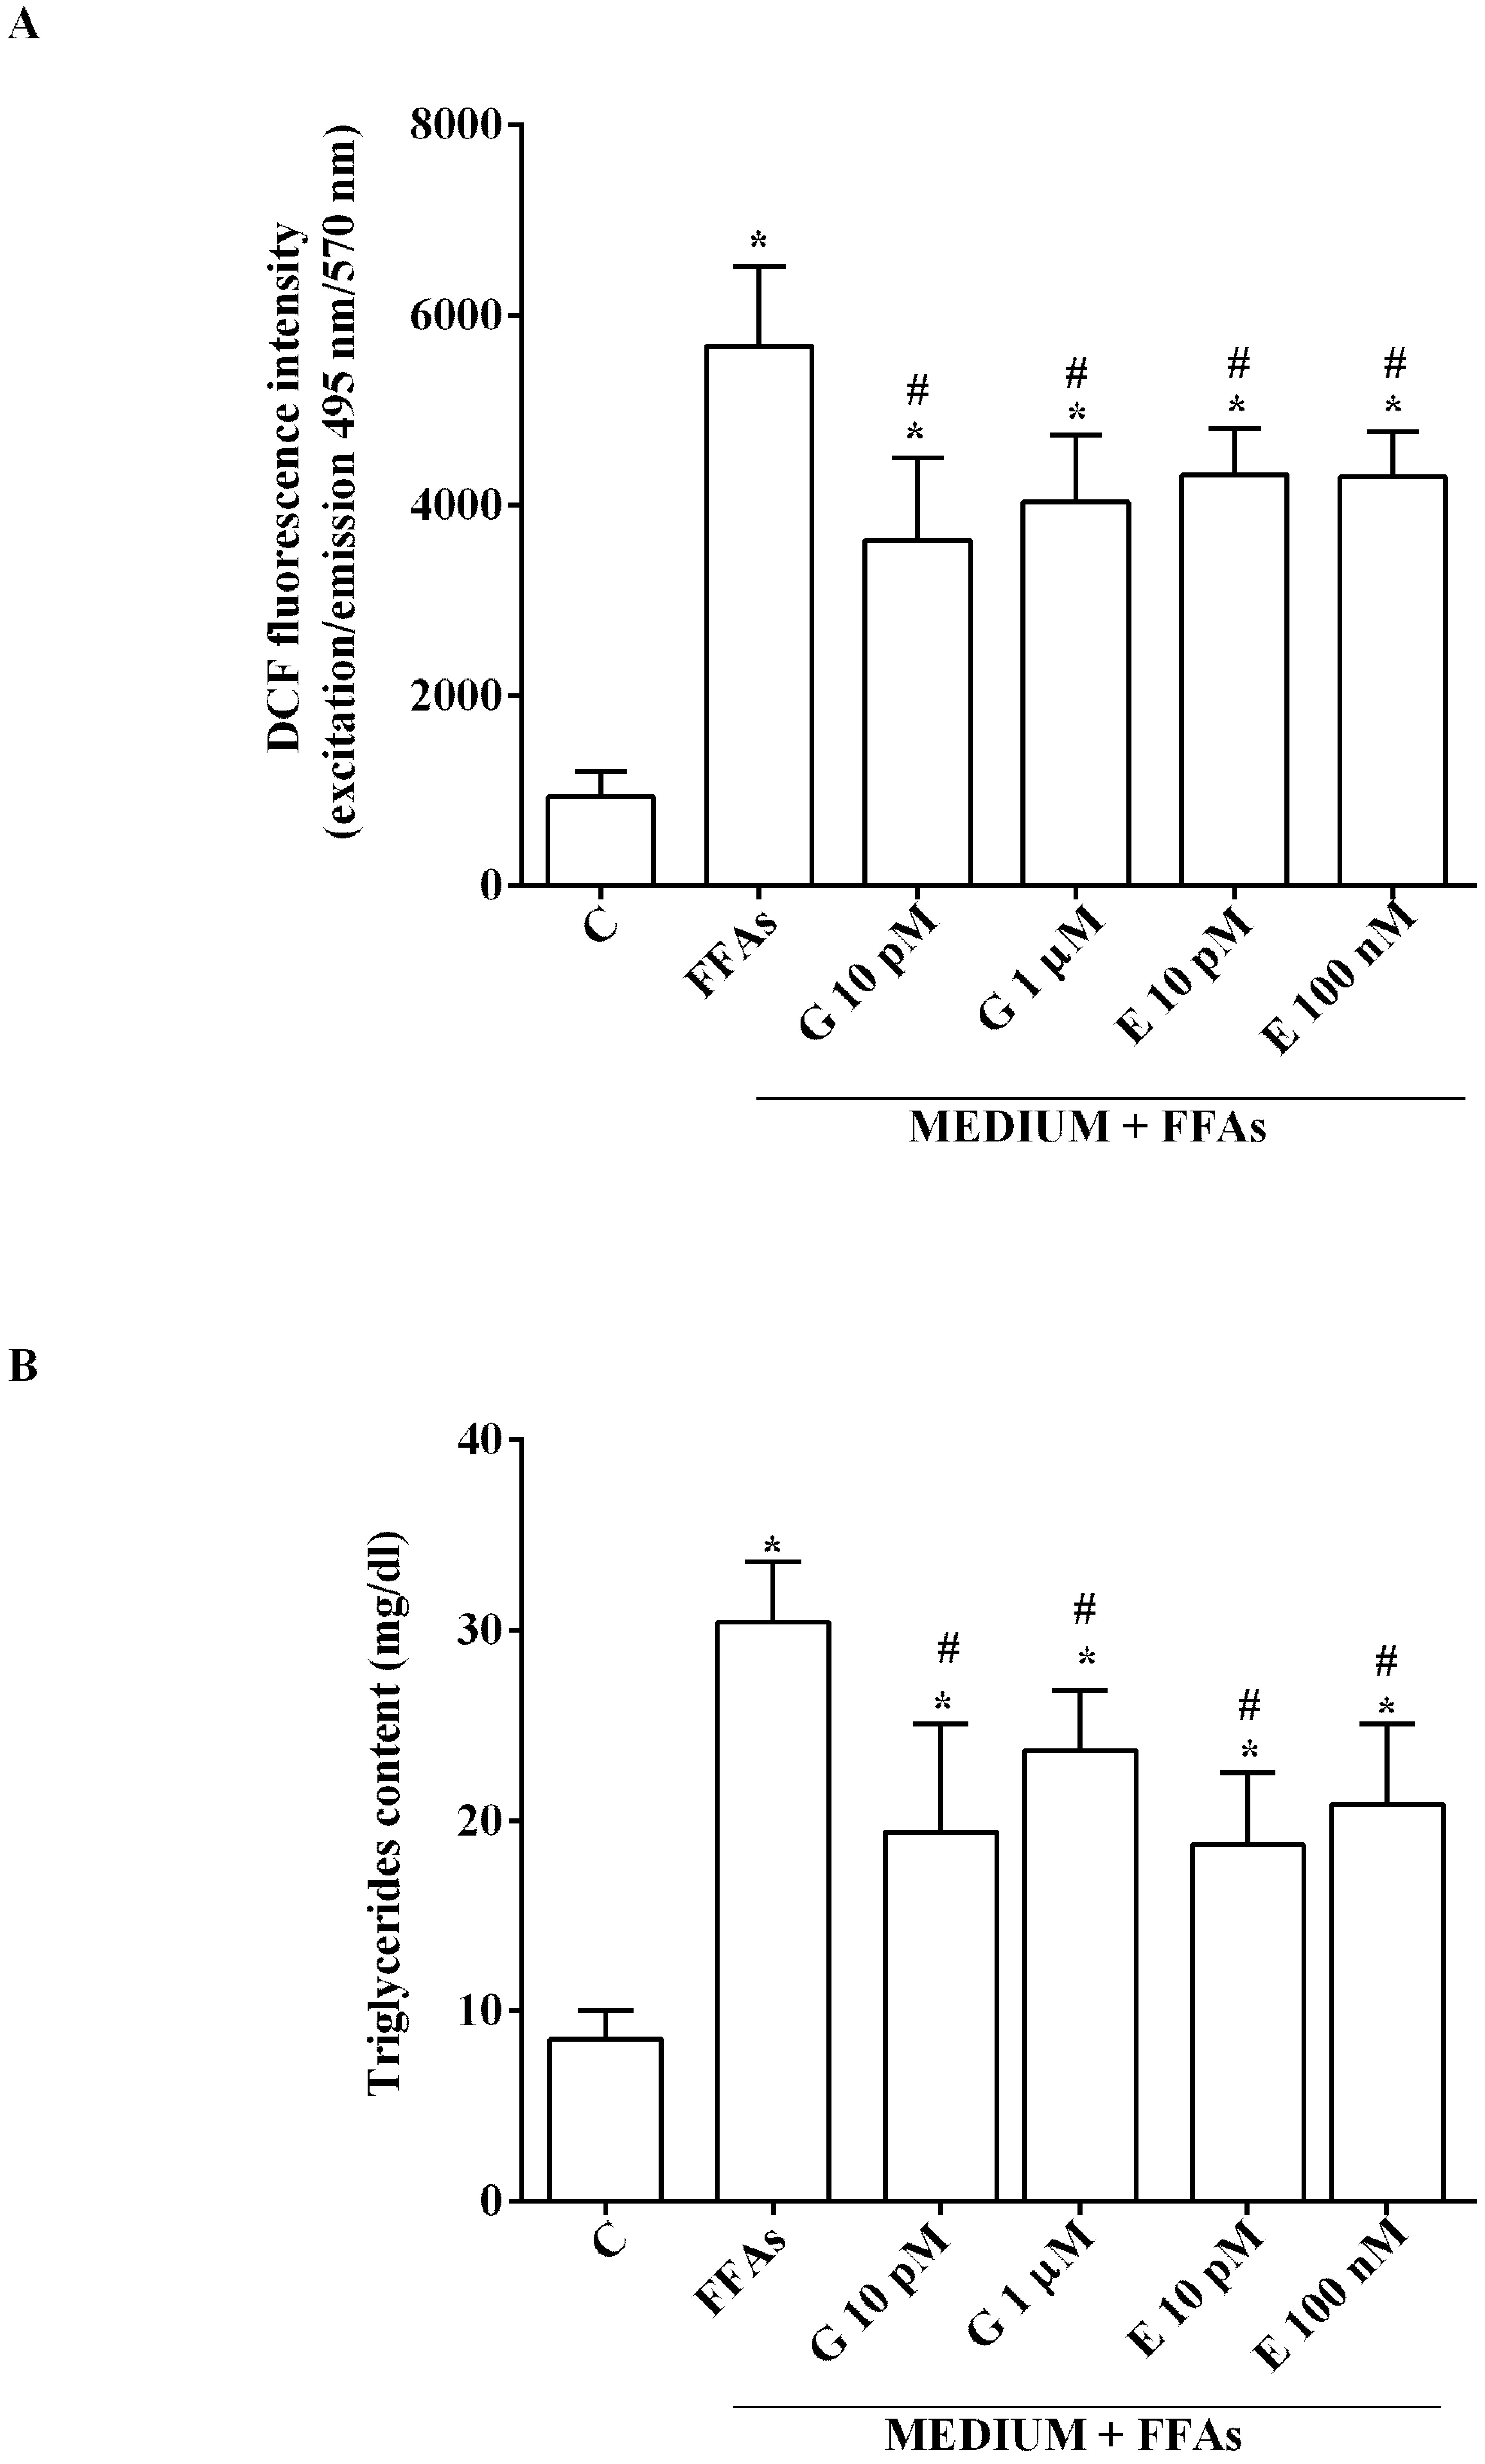
Fig. 3. Effects of genistein and 17β-estradiol on ROS production (A) and triglycerides content (B) in Huh7.5 cells. In A, results are expressed as DCF fluorescence intensity, which is proportional to the amount of intracellular ROS. In B, results are expressed as triglycerides content (mg/dl) produced after each stimulation. G: genistein; E: 17β-estradiol. C=control (non-treated cells); FFAs=free fatty acids. Reported data are means ± SD of five independent experiments for each experimental protocol. Significance between groups: *P<0.05 vs C; #p<0.05 vs. FFAs.